Heki, K., Seasonal Modulation of Interseismic Strain Buildup in Northeastern Japan Driven by Snow Loads
Science, 293, 89-92, 2001.
Å@Distinct periodic variations with annual frequencies are often found in the ti me series of continuous Global Positioning System (GPS) site coordinates in northea stern Japan. They show maximum arc-normal contraction of a few millimeters as well as maximum subsidence of 1 to 2 centimeters, both in March. In northeastern Japan, it snows heavily on the western flank of the backbone range, attaining a maximum depth of several meters in March. When observed snow depths were compared with the load distribution estimated from the GPS data, the surface loads caused by t he snow were found to be largely responsible for the annual displacement of GPS sit es. The snow load modulates secular strain build-up in northeastern Japan due to the Pacific Plate subduction, but its relevance to the seasonal change of earthquake occurrences remains uncertain.
Å@The GPS Earth Observation Network (GEONET), the nationwide continuous GPS arra
y
run by the Geographical Survey Institute (GSI), Japan, has been useful as a sens
or for secular
(1) and earthquake-specific (2,3) crustal deformation. These GPS site coordinat
es often
show conspicuous seasonal variations in addition to interseismic secular movemen
ts.
Recently, Murakami & Miyazaki (4) found that the seasonal signals are coherent i
n phase to a
large extent and their amplitudes are systematic in space. They fixed a station
in central
Japan (Komatsu, Fig. 1) and showed that the directions of the annual signals rel
ative to
Komatsu coincide with the plate convergence at the Japan Trench and that their a
mplitudes
are larger where secular velocities are faster. These features suggest an unfor
eseen
possibility that the plate velocity or the coupling strength at depth changes an
nually, i.e. faster
subduction or stronger coupling occurs in winter.
Å@Murakami & Miyazaki (4) confirmed that the annual signals are consistent for d
ifferent
receiver and antenna types, and for the solutions with different software packag
es with and
without the estimation of atmospheric delay gradients (5). They further confirm
ed that
similar annual signals exist in the data from the Japanese domestic very long ba
seline
interferometry (VLBI) observations (6). Thus, despite the lack of physical expl
anation for
the seasonal variations, they suggested that the signals are real. Here I inves
tigated whether
snow accumulation in northeastern Japan can provide a sufficient surface load to
reproduce
the necessary elastic deformation of the solid Earth to account for the GPS vari
ations. Such
a finding would thus serve as an independent confirmation of the reality of the
signal.
Å@Daily solutions of the GEONET GPS site coordinates relative to the central sta
tion at
Tsukuba, Ibaraki (Fig. 1), were taken from the GSI website (www.gsi.go.jp) for n
ortheastern
Japan covering the period 1998.9 to 2001.0. The data are based on a routine ana
lysis strategy
(7) of GSI and are essentially of the same quality as the 1996 to 1999 data used
by Murakami
& Miyazaki (4). They fixed the Komatsu station (Fig. 1) because its secular vel
ocity
represents that of the Eurasian Plate. Here, however, I considered pairs of GPS
points that
represent the western and eastern sides of the island arc, and compared their ba
seline length
time series.
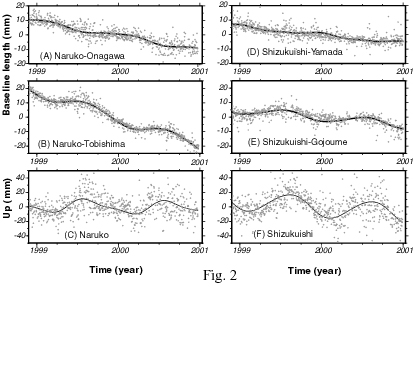
Å@The baselines on the Japan Sea side have large annual components: they shorten
by a few
millimeters in winter (Fig. 2B,E), a result consistent with (4). On the other h
and, seasonal
signatures are smaller on the Pacific side of the arc (Figure 2A,D) and have the
opposite
sense (shortening in summer). Such a contrast across the backbone range is seen
for most
pairs of baselines. If the annual signal reflects changes in the convergence ra
te or the
coupling strength at the Japan Trench, its amplitude would be proportional to th
e secular
shortening rate irrespective of which side of the arc the baseline lies. Anothe
r feature not
mentioned in (4) is the annual signals in vertical components (Fig. 2C,F). Most
of the sites
subside relative to Tsukuba in the winter, and the amplitudes, up to ~2 cm peak-
to-peak, are
larger along the backbone range than along the coasts. Neither faster subductio
n nor
stronger coupling predicts such a subsidence pattern for the arc. These feature
s make the
trench-origin mechanisms untenable.
Å@Four seasons characterize the environment in Japan. In winter, cold and dry a
ir over
Siberia becomes humid as it travels across the Japan Sea, leaving heavy snowfall
s as it
collides with the backbone range of the northeastern Japan. Snow mainly falls o
n the
western side of the arc but the amounts vary from place to place. The deepest s
now, seen
along the western flank of the backbone range, starts to accumulate in late autu
mn reaching a
few meters deep in March; it then disappears in May (Fig. 1) except at the highe
st peaks.
Loads on EarthÅfs surface cause subsidence beneath and around the load, along wi
th horizontal
deformation such that the land shortens beneath the load and extends outside of
it. Snow
loads distributed along the western half of the arc would cause crustal deformat
ion
qualitatively consistent with the GPS baseline data (Fig. 2), arc-normal crustal
shortening
beneath the snow cover (Fig. 2B,E), and smaller extension outside the cover (Fig
. 2A,D). It
would also cause the subsidence whose maximum lies below the snow load center (F
ig.
2C,F).
Å@Next, I fixed an arbitrary station, and modeled each component of the relative
position time
series of 88 GPS points in northeastern Japan with the linear, annual and biannu
al terms (8).
I discarded 13 sites (9) whose root-mean-squares of the post-fit residuals excee
ded 4 mm
(horizontal) or 15 mm (vertical). Then, I obtained instantaneous values of the
periodic
components on 15 March (relative to 15 August) for all the sites (Fig. 3) and es
timated the
load (heights of the water columns above ground) on each of the rectangular area
s as large as
0.5 o in latitude and 0.75 o in longitude covering the land area in Fig. 3 that
best explained the
observed winter-summer site displacements in a least-squares sense (10). I simu
ltaneously
estimated the translation of the whole network to ensure that the obtained loads
were free
from the fixed-point problem. To calculate site displacements due to a unit loa
d on an
elastic half space, I used the formulation by Farrel (11), 30 GPa for rigidity a
nd 0.25 for
PoissonÅfs ratio. Typical formal errors of the estimated load were around 20 to
25 cm, and
the post-fit residuals of the input data were 1.3 mm, 0.9 mm, and 2.9 mm for the
north, east,
and up components, respectively.
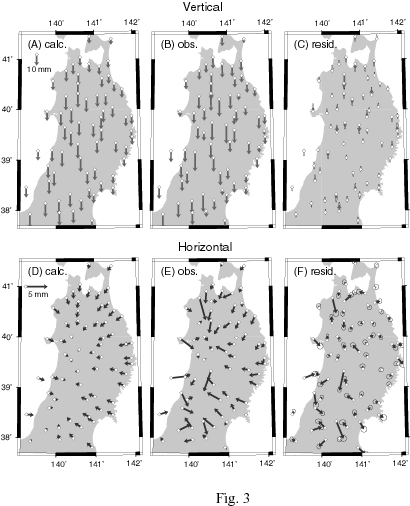
Å@In Fig. 3, some stations have anomalously large residuals, a part of which mig
ht be
explained by localized high snow masses often found over the high mountains. No
ntheless,
the observations agree with the calculated displacements. To convert the load i
nto snow
depth, I needed data for average snow density, which can be obtained only by fie
ld
observations of snow cross sections. Such observations have been carried out at
Mount Zao
(Fig. 1D), and Yamaya et al. (12) report that the average snow densities there d
uring the
1999 to 2000 winter increased with time, i.e. 0.30 to 0.32 g/cm3 from
January to February, 0.42
g/cm3 in late March, and 0.50 to 0.53 g/cm3 from the end o
f April to May.
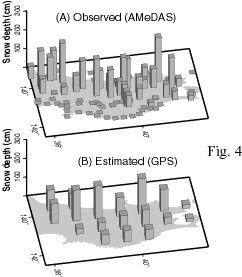
Å@I assumed a snow density of 0.4 g/cm3 in the middle of March to con
vert the load into
snow depth, and compared the resulting estimates with snow depth data acquired o
n 15
March 2000 at AMeDAS (Automated Meteorological Data Acquisition System) stations
(13)
(Fig. 4). The data sets were fairly consistent (14), which suggested that the s
now could
explain most of the annual GPS variations. Other hydrological factors (e.g. soi
l moisture
and groundwater) would be less important, but they would reduce the sharpness of
the load
decrease by spring thawing. Atmospheric pressure increase in winter (~1 kPa (15
) in
northeastern Japan) would act as the equivalent of additional snow as deep as 25
cm for the
entire land area and would enhance the annual signature by ~10 %. Snow covers a
re
ubiquitous in high- to mid-latitude areas on Earth. Snow loads, together with v
arious water
loading mechanisms (16), would annually distort the terrestrial reference frame
composed of
world-wide distributed stations. This would substantially affect the determinat
ion of GPS
orbits because the current accuracy of the terrestrial reference frame is ~1 cm
or better (17).
(Here I discussed relative displacements within a local network, which are littl
e affected by
such errors, but annual variations in global GPS networks are more sensitive to
the annual
orbital errors and need to be examined carefully.)
Å@The snow loads modulate interseismic stress build-up in northeastern Japan (Fi
g. 2 B and
E). Seasonality in earthquake occurrences is a century-long issue (18) in Japan
ese
seismology, and Murakami & Miyazaki (4) suggested the relevance of the seasonal
strain
changes to the seismicity. Mogi (19) compiled historical (M>7.9) and modern (M>
7.5)
earthquakes, and found that the peak in seismicity exists in March in northeaste
rn Japan and
in December in central Japan. Ohtake & Nakahara (20) confirmed the statistical
significance of the seasonality in central Japan, and evaluated its relevance to
the atmospheric
pressure increase of ~1 kPa in winter. They showed that this high pressure qual
itatively
encourages reverse slips at the plate interface but the stress changes are only
a few tens of Pa
in terms of the Coulomb failure function (CFF) (21). This is not more than the
semi-diurnal
tidal stress increase of up to ~1 kPa, which is not effective in triggering eart
hquakes (21).
Å@ Recently, Gao et al. (22) suggested that the higher activity of the 1992 Lan
ders event
aftershocks in summer might be due to the atmospheric pressure change of ~2 kPa,
which is
an order of magnitude smaller than the minimum static stress changes previously
considered
to trigger aftershocks. The snow loads inferred in the present study are equiva
lent to an
increase of up to ~10 kPa in atmospheric load, and a calculation similar to that
in (20) shows
that they cause positive CFF change at the plate interface dipping westward from
the Japan
Trench (Fig.1). However, the same calculation also indicates that the large dis
tance between
the load and the fault reduces the CFF change down to the level of 0.1 kPa. Thi
s would be
too small to let us conclude that there is a causal relation between earthquakes
and the snow
loads, even if we took into account that the earthquake-triggering mechanisms ar
e not well
understood.
REFERENCES
1. S. Miyazaki, K. Heki, J. Geophys. Res. 106, 4305 (2001).
2. H. Tsuji, Y. Hatanaka, T. Sagiya, M. Hashimoto, Geophys. Res. Lett. 22, 1669
(1995).
3. K. Heki, S. Miyazaki, H.Tsuji, Nature 386, 595 (1997).
4. M. Murakami, M. S. Miyazaki, Geophys. Res. Lett. in press.
5. D.S. MacMillan, Geophys. Res. Lett. 22, 1041 (1995).
6. R. Ichikawa et al., Proceedings of the Third Joint Meeting of U.S.-Japan Natu
ral
Resources Panel on Earthquake Research (2001).
7. S. Miyazaki, T. Saito, M. Sasaki, Y. Hatanaka, Y. Iimura, Bull. Geog. Survey
Inst. 43, 23
(1997).
8. The annual variation curve is asymmetric about the peak. For example, the sub
sidence in
winter is somewhat slower than the uplift in spring (Fig.2C, F), which can be mo
deled by
combining annually and biannually changing terms. It was also confirmed that th
e
results are not dependent on the particular station chosen as the fixed point.
9. The discarded stations mostly belong to the first generation GPS points (esta
blished in
1994) of GEONET and are not concentrated in a particular area. They had larger
post-fit
residuals than the newer points.
10. A weak continuity constraint was imposed to stabilize the solution so that t
he difference
of the loads of the adjacent rectangles is 0 +/- 20 cm (or +/- 50 cm for the dep
th of snow as
dense as 0.4 g/cm3).
11. W.E. Farrel, Rev. Geophys. Space Phys. 10, 761 (1972).
12. M. Yamaya et al., Tohoku J. Natural Disaster Sci. 36, 171 (2000).
13. Japan Meteorological Agency, Monthly report of Japan Meteorological Agency,
vol. 3,
No. 5 (2000).
14. Because AMeDAS stations need public electricity and communication lines, the
y are
generally located in inhabited lowlands. This may have negatively biased observ
ed
snow depths, and would partly explain the apparent absence of snow on the Pacifi
c side in
Fig. 4A.
15. National Astronomical Observatory (ed.), Chronological Scientific Tables 74
(Maruzen,
Tokyo, 2000).
16. T. van Dam et al., Geophys. Res. Lett. 28, 651 (2001)
17. P. Sillard, Z. Altamimi, C. Boucher, Geophys. Res. Lett. 25, 3223 (1998).
18. F. Omori, Pub. Earthquake Investigation Comm. 8, 1 (1902).
19. K. Mogi, Bull. Earthq. Res. Inst. 47, 419 (1969).
20. M. Ohtake, H. Nakahara, PAGEOPH 155, 689 (1999).
21. R.S. Stein, Nature 402, 605 (1999).
22. S.S. Gao, P.G. Silver, A.T. Linde, I.S. Sacks, Nature 406, 500 (2000).
23. K. Heki et al., J. Geophys. Res. 104, 29147 (1999).
24. I thank Makoto Murakami, who first reminded me of the geophysical importance
of the
annual signals. I also thank Tetsuya Iwabuchi for providing AMeDAS snow depth d
ata,
and ShinÅfichi Miyazaki for reviewing the earlier version of the manuscript.
26 March 2001; accepted 31 May 2001
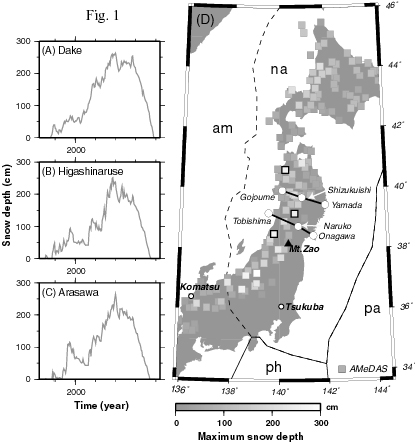
Fig. 1. (A to C) Time series of snow depth during the 1999 to 2000 winter season
at three
points shown in (D) by squares drawn with bolder lines (tick marks in the horizo
ntal axes
show months). Other squares in (D) show the maximum snow depths in the 1999 to
2000
winter obtained at the AMeDAS sites (13). Only sites with maximum depths of >30
cm
are plotted. In (D), tectonic plates and their boundaries are shown [na, North
American
Plate; am, Amurian Plate (23); pa, Pacific Plate; ph, Philippine Sea Plate]; lin
es connecting
the white circles are the baselines whose changes in lengths are plotted in Fig.
2.
Fig. 2. Time series, covering the period 1998.9 to 2001, of the baseline lengths
on the eastern
(A and D) and the western (B and E) sides of northeastern Japan. (C and F) Vert
ical
position of the Naruko and Shizukuishi stations, respectively, relative to Tsuku
ba, Ibaraki,
far to the south (Fig. 1D). Gray dots show daily solutions; solid curves are be
st-fit lines
assuming periodic (annual and biannual) and linear changes.
Fig. 3. Values of the periodic terms of the vertical (A to C) and horizontal (D
to F)
coordinates on 15 March relative to 15 August [(B) and (E)], those calculated fr
om the
estimated loads distribution [(A) and (D)] and their differences [(C) and (F)].
Error
ellipses attached to the residual vectors show 1 sigma uncertainties of the obse
rved vectors.
Translation of the whole network, estimated together with loads, is added to the
observed
vectors to make them absolute.
Fig. 4. (A) Snow depth data at the AMeDAS (13) sites on the middle day of March
2000. (B)
Snow depths converted from the loads estimated by the GPS data. The average snow
density was assumed to be 0.4 g/cm3.